Bom: 539083 – Inox Wind Ltd Share Price
As an investor constantly tracking renewable energy stocks, I’ve been keeping a close eye on Inox Wind (BOM: 539083). Let me break down everything you need to know about this wind energy powerhouse and where it might be headed.
Table of Contents
Understanding Inox Wind Ltd: A Quick Overview
Inox Wind has established itself as one of India’s leading wind energy solutions providers. They manufacture wind turbine generators and offer turnkey solutions for wind farm projects. What caught my attention is their integrated manufacturing facilities in Gujarat, Himachal Pradesh, and Madhya Pradesh.
Inox Wind Ltd – Stock Summary
| Parameter | Value |
| Market Cap | ₹22,416 Cr. |
| Current Price | ₹172 |
| High / Low | ₹262 / ₹107 |
| Stock P/E | 83.8 |
| Book Value | ₹17.1 |
| ROCE | 3.17% |
| ROE | -0.69% |
| Dividend Yield | 0.00% |
| Face Value | ₹10.0 |
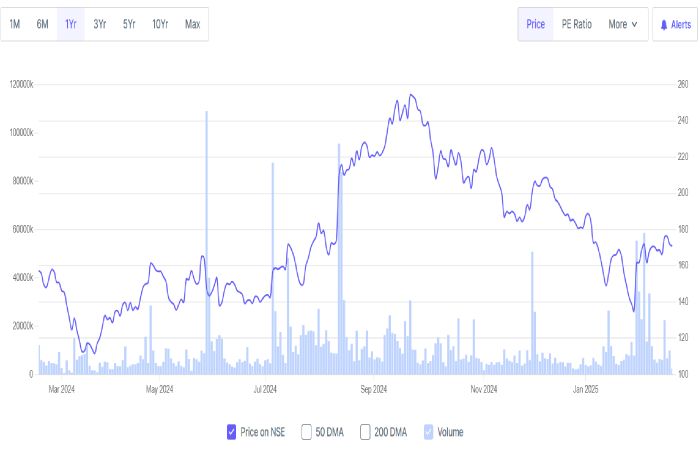
Current Market Performance and Recent Trends
The stock (BOM: 539083) has been showing interesting movements lately. The company’s order book has been growing, particularly with the increasing focus on renewable energy in India. However, like many in the sector, they’ve faced their share of challenges.
Peer Comparison
| S.No | Name | CMP Rs. | P/E | Market Cap (Cr.) | Dividend Yield % | NP Qtr (Cr.) | Qtr Profit Var % | Sales Qtr (Cr.) | Qtr Sales Var % | ROCE % |
| 1 | Siemens | 4990.85 | 78.15 | 177734.40 | 0.24 | 614.60 | -9.59 | 3587.20 | -3.30 | 23.61 |
| 2 | ABB | 5263.75 | 66.08 | 111543.27 | 0.45 | 440.45 | 21.68 | 2912.16 | 5.16 | 30.69 |
| 3 | CG Power & Ind | 552.35 | 90.14 | 84444.62 | 0.24 | 237.85 | 21.01 | 2515.68 | 27.13 | 46.63 |
| 4 | Suzlon Energy | 51.14 | 59.15 | 69230.64 | 0.00 | 387.76 | 90.56 | 2974.83 | 90.64 | 24.93 |
| 5 | BHEL | 193.31 | 129.68 | 67311.77 | 0.13 | 134.70 | 123.31 | 7277.09 | 32.22 | 3.37 |
| 6 | Waaree Energies | 2103.90 | 61.16 | 60441.51 | 0.00 | 506.88 | 370.92 | 3457.29 | 116.60 | 43.63 |
| 7 | Hitachi Energy | 11289.35 | 152.50 | 47846.16 | 0.04 | 137.38 | 498.08 | 1620.27 | 27.16 | 17.85 |
| 8 | Inox Wind | 171.93 | 83.83 | 22416.13 | 0.00 | 59.24 | 707.43 | 927.51 | 87.47 | 3.17 |
Quarterly Results
| Quarter | Sales (Cr.) | Expenses (Cr.) | Operating Profit (Cr.) | OPM % | Other Income (Cr.) | Interest (Cr.) | Depreciation (Cr.) | Profit Before Tax (Cr.) | Net Profit (Cr.) | EPS (Rs.) |
| Dec 2021 | 95 | 124 | -29 | -30% | 33 | 43 | 10 | -49 | -32 | -0.36 |
| Mar 2022 | 70 | 283 | -213 | -304% | 32 | 53 | 9 | -243 | -157 | -1.77 |
| Jun 2022 | 173 | 216 | -43 | -25% | 4 | 52 | 9 | -101 | -101 | -0.91 |
| Sep 2022 | 81 | 117 | -37 | -46% | 6 | 60 | 9 | -100 | -100 | -0.90 |
| Dec 2022 | 177 | 375 | -198 | -112% | 241 | 58 | 10 | -26 | -26 | -0.23 |
| Mar 2023 | 153 | 194 | -41 | -27% | 7 | 43 | 12 | -88 | -88 | -0.68 |
| Jun 2023 | 289 | 290 | -1 | -0% | -15 | 41 | 10 | -67 | -67 | -0.52 |
| Sep 2023 | 330 | 319 | 11 | 3% | -14 | 41 | 11 | -54 | -54 | -0.41 |
| Dec 2023 | 495 | 445 | 50 | 10% | -11 | 36 | 10 | -7 | -7 | -0.05 |
| Mar 2024 | 470 | 411 | 59 | 13% | -118 | 32 | 11 | -102 | -102 | -0.78 |
| Jun 2024 | 607 | 509 | 98 | 16% | 21 | 38 | 12 | 70 | 70 | 0.54 |
| Sep 2024 | 676 | 577 | 98 | 15% | 12 | 28 | 12 | 70 | 70 | 0.54 |
| Dec 2024 | 928 | 751 | 176 | 19% | 3 | 32 | 14 | 135 | 59 | 0.45 |
Why Is Inox Wind Share Falling?
I’ve noticed several factors affecting the stock’s recent performance:
- Supply chain disruptions impacting component availability
- Rising raw material costs putting pressure on margins
- Intense competition in the renewable energy sector
- Working capital challenges affecting project execution
- Global economic uncertainties influencing investor sentiment
Latest News and Developments
Recent developments that caught my eye include:
- New order wins from independent power producers
- Expansion of manufacturing capabilities
- Strategic partnerships for technology enhancement
- Government policy support for wind energy sector
- Improvements in operational efficiency
Inox Wind Share Price Target 2025
Based on current market dynamics and growth projections, here’s my analysis of where the stock might head by 2025:
- Industry growth trajectory suggests potential upside
- Government’s renewable energy push could be a major catalyst
- Operational improvements might enhance profitability
- Order book growth indicates strong revenue visibility
- Technological advancements could improve margins
Note: These targets are based on analysis and market conditions – always do your own research before investing.
INOX WIND Last 5 Annual Financial Results
| Consolidated | Mar 2024 | Mar 2023 | Mar 2022 | Mar 2021 | Mar 2020 |
| Revenues | ₹733 Cr | ₹625 Cr | ₹711 Cr | ₹760 Cr | ₹1,437 Cr |
| Expenses | ₹998 Cr | ₹937 Cr | ₹876 Cr | ₹890 Cr | ₹1,288 Cr |
| Operating Profit (Excl OI) | ₹-264 Cr | ₹-312 Cr | ₹-165 Cr | ₹-130 Cr | ₹149 Cr |
| Other Income | ₹21 Cr | ₹31 Cr | ₹76 Cr | ₹24 Cr | ₹23 Cr |
| Interest | ₹327 Cr | ₹283 Cr | ₹255 Cr | ₹244 Cr | ₹169 Cr |
| Depreciation | ₹98 Cr | ₹89 Cr | ₹88 Cr | ₹80 Cr | ₹66 Cr |
| Profit Before Tax | ₹-669 Cr | ₹-653 Cr | ₹-459 Cr | ₹-430 Cr | ₹-62 Cr |
| Profit After Tax | ₹-697 Cr | ₹-483 Cr | ₹-307 Cr | ₹-279 Cr | ₹-40 Cr |
| Consolidated Net Profit | ₹-709 Cr | ₹-480 Cr | ₹-306 Cr | ₹-280 Cr | ₹-40 Cr |
| Earnings Per Share (Rs) | ₹-1.24 | ₹-21.74 | ₹-21.64 | ₹-13.77 | ₹-12.60 |
| PAT Margin (%) | -2.91 | -95.06 | -77.26 | -43.21 | -36.75 |
| ROE (%) | -2.98 | -53.13 | -43.36 | -20.46 | -15.31 |
| ROCE (%) | 4.44 | -8.91 | -11.53 | -7.16 | -6.12 |
| Total Debt/Equity (x) | 1.91 | 1.40 | 0.94 | 1.19 | 0.66 |
Key Financials
| Metric | Value |
| Market Cap | ₹22,425.4 Cr |
| Revenue (TTM) | ₹2,810.1 Cr |
| Net Profit (TTM) | ₹287.3 Cr |
| EPS (TTM) | ₹2.2 |
| P/E (TTM) | 78.0 |
Industry Peers & Returns
| Company | 1W | 1M | 1Y |
| INOX WIND | 2% | 3.4% | 33.9% |
| SIEMENS | -6.8% | -19.3% | 16.6% |
| ABB INDIA | -5.7% | -19.5% | 19.2% |
| HAVELLS INDIA | -6.1% | -4.8% | 10.2% |
| CG POWER AND INDUSTRIAL SOLUTIONS | -6.7% | -14.8% | 32.8% |
| SUZLON ENERGY | -3% | -10% | 15.8% |
| HITACHI ENERGY INDIA | -7.7% | -12.6% | 100.3% |
| APAR INDUSTRIES | -5.1% | -36.9% | 11% |
| GE T&D INDIA | -10.8% | -24.4% | 86.1% |
INOX WIND Revenues
| Years | Revenues | % Change |
| 2024 Mar | ₹733 Cr | ▲ 17.36% |
| 2023 Mar | ₹625 Cr | ▼ -12.11% |
| 2022 Mar | ₹711 Cr | ▼ -6.51% |
| 2021 Mar | ₹760 Cr | ▼ -47.12% |
| 2020 Mar | ₹1,437 Cr | – |
Growth Metrics:
- Year-on-Year (Y-o-Y): 17.36% (positive)
- 5-Year CAGR: -15.49% (negative)
INOX WIND Operating Profit
| Years | Operating Profit | % Change |
| 2024 Mar | ₹-264 Cr | ▼ Negative |
| 2023 Mar | ₹-312 Cr | ▼ Negative |
| 2022 Mar | ₹-165 Cr | ▼ Negative |
| 2021 Mar | ₹-130 Cr | ▼ Negative |
| 2020 Mar | ₹149 Cr | – |
Growth Metrics:
- Year-on-Year (Y-o-Y): Negative
- 5-Year CAGR: Negative
INOX WIND Financial Data
Revenue
| Year | Revenue (₹ Cr) | % Change |
| 2024 Mar | 733 | ▲ 17.36% |
| 2023 Mar | 625 | ▼ -12.11% |
| 2022 Mar | 711 | ▼ -6.51% |
| 2021 Mar | 760 | ▼ -47.12% |
| 2020 Mar | 1,437 | – |
Operating Profit
| Year | Operating Profit (₹ Cr) | % Change |
| 2024 Mar | -264 | ▼ Negative |
| 2023 Mar | -312 | ▼ Negative |
| 2022 Mar | -165 | ▼ Negative |
| 2021 Mar | -130 | ▼ Negative |
| 2020 Mar | 149 | – |
Operating Margins
| Year | Operating Margin (%) | % Change |
| 2024 Mar | -36.08% | ▼ Negative |
| 2023 Mar | -50.01% | ▼ Negative |
| 2022 Mar | -23.27% | ▼ Negative |
| 2021 Mar | -17.12% | ▼ Negative |
| 2020 Mar | 10.39% | – |
Profit After Tax (PAT)
| Year | Profit After Tax (₹ Cr) | % Change |
| 2024 Mar | -709 | ▼ Negative |
| 2023 Mar | -480 | ▼ Negative |
| 2022 Mar | -306 | ▼ Negative |
| 2021 Mar | -280 | ▼ Negative |
| 2020 Mar | -40 | – |
PAT Margins
| Year | PAT Margin (%) | % Change |
| 2024 Mar | -2.91% | ▼ Negative |
| 2023 Mar | -95.06% | ▼ Negative |
| 2022 Mar | -77.26% | ▼ Negative |
| 2021 Mar | -43.21% | ▼ Negative |
| 2020 Mar | -36.75% | – |
Earnings Per Share (EPS)
| Year | EPS (₹) | % Change |
| 2024 Mar | -1.24 | ▼ Negative |
| 2023 Mar | -22 | ▼ Negative |
| 2022 Mar | -22 | ▼ Negative |
| 2021 Mar | -14 | ▼ Negative |
| 2020 Mar | -13 | – |
Key Observations:
- Revenue Growth: Inox Wind’s revenue grew 17.36% YoY in 2024 but has been declining over the past five years (-15.49% CAGR).
- Operating Profit & Margins: The company has been operating at a loss, with negative margins worsening over time.
- Profit After Tax: Losses have increased significantly, reaching ₹-709 Cr in 2024.
- EPS Decline: The EPS remains negative, indicating continued financial struggles.
Looking Further: Inox Wind Share Price Target 2030
The long-term outlook for Inox Wind (BOM: 539083) is tied to several factors:
- India’s renewable energy goals
- Technological evolution in wind energy sector
- Global clean energy transition
- Company’s execution capabilities
- Market competition and positioning
Investment Considerations
Before making any investment decisions, consider:
- The company’s debt levels and working capital management
- Order book execution timeline
- Industry competitive dynamics
- Government policies and incentives
- Global renewable energy trends
Future Growth Catalysts
I’ve identified several potential growth drivers:
- Increasing focus on renewable energy
- Government initiatives supporting clean energy
- Growing electricity demand in India
- Technological improvements reducing costs
- Export opportunities in emerging markets
Risk Factors to Consider
Keep these potential challenges in mind:
- Interest rate fluctuations
- Raw material price volatility
- Policy changes affecting renewable energy
- Competition from solar energy
- Working capital management
Bottom Line
Inox Wind (BOM: 539083) operates in a promising sector with significant growth potential. While there are short-term challenges, the long-term outlook appears positive, supported by India’s renewable energy push and global clean energy transition. Remember to conduct thorough research and consider your investment goals before making any decisions.
Keep tracking BOM: 539083 for latest updates and market movements. The renewable energy sector’s dynamics make this an interesting stock to watch in the coming years.
FAQ about Bom: 539083
How the annual revenues of INOX WIND have changed ?
The Revenues of INOX WIND have increased by 17.36% YoY .
How the Earnings per Share (EPS) of INOX WIND have changed?
The Earnings Per Share (EPS) of INOX WIND has decreased by Negative YoY.